Multimodal spectroscopy techniques for nanostructured materials characterization

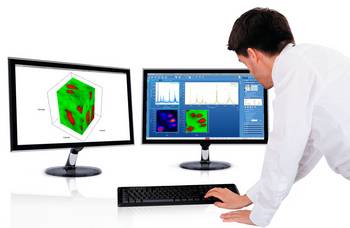
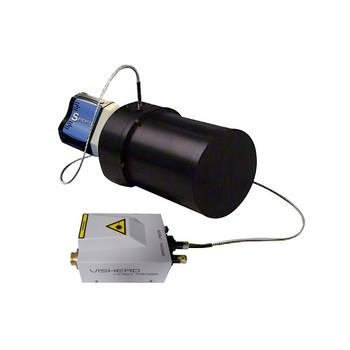
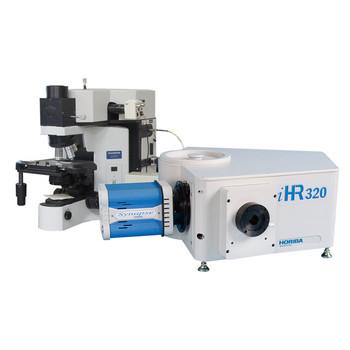
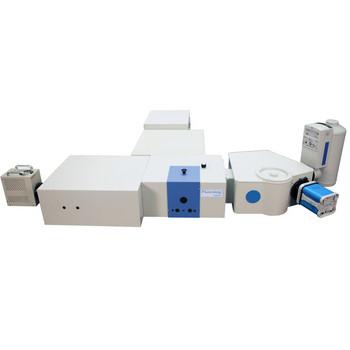
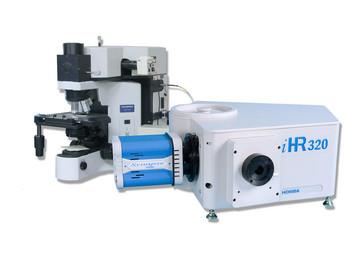
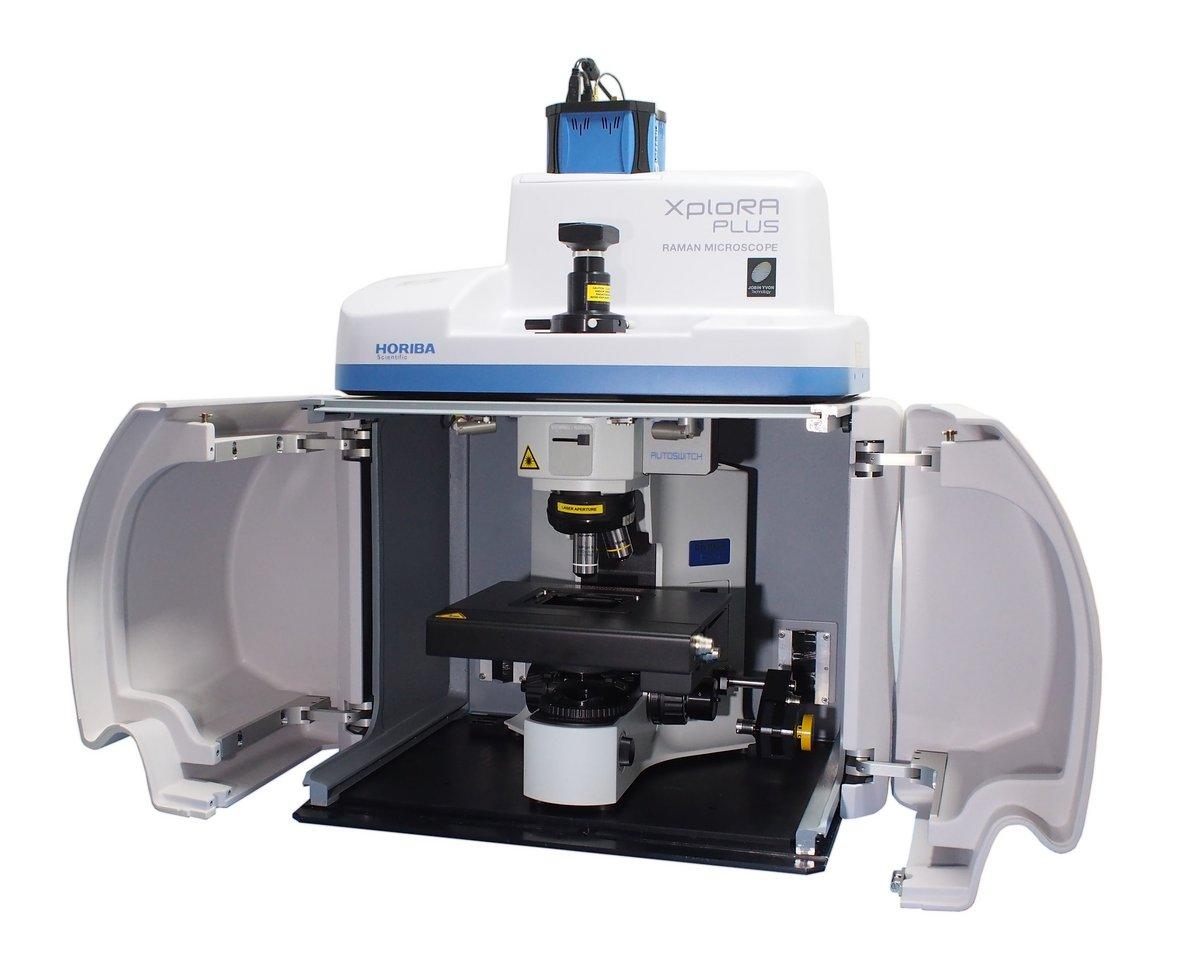
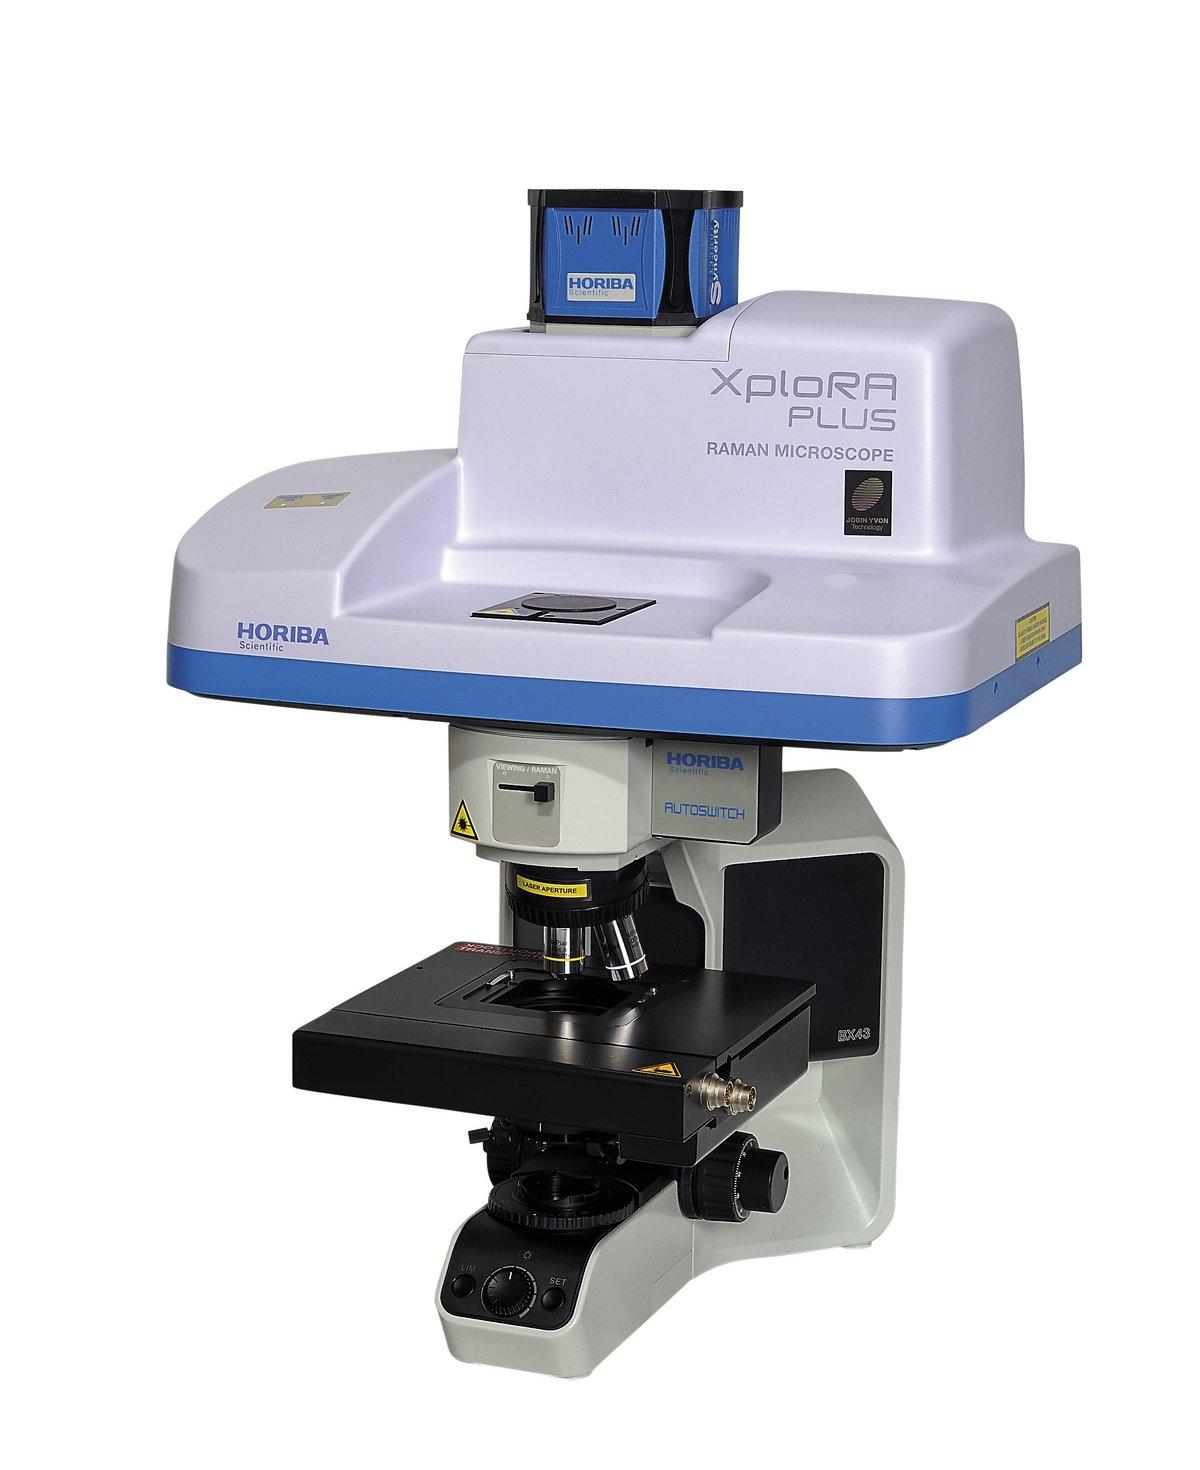
In this article, we present the combination of Raman spectroscopy, Photoluminescence and SEM-CL techniques, where the instruments weren’t physically connected. Smart nanostructured materials require a comprehensive understanding of their morphology, elemental and chemical composition. nanoGPS Suite solution allows a colocalized combination of a variety of microscopy techniques, providing a full characterization of nanostructured materials and a precise superimposition of the results obtained.


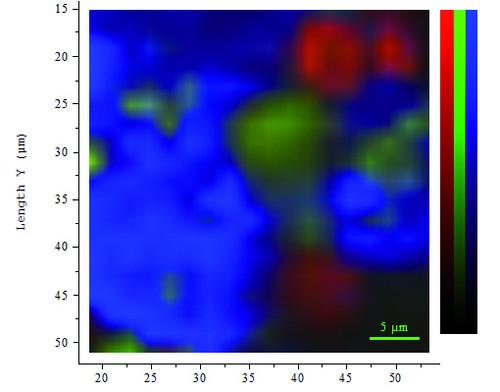
.")
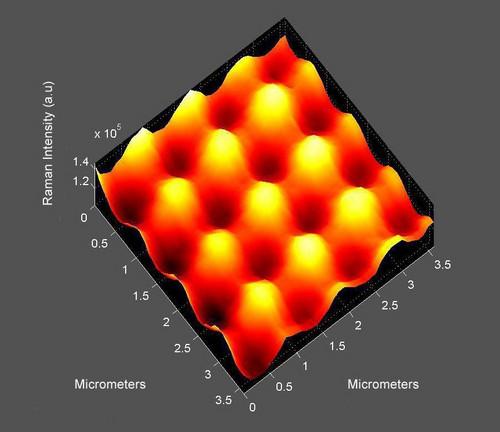

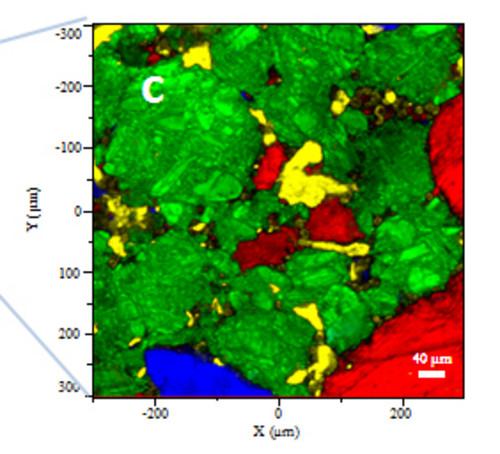

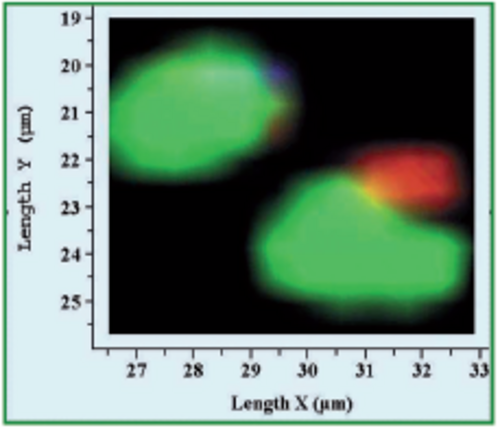
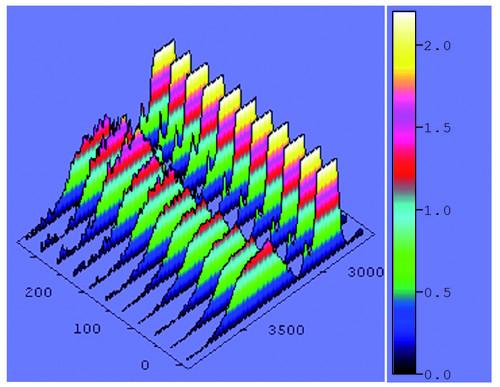


 Raman map of MoS2 layers.")