Presentation video
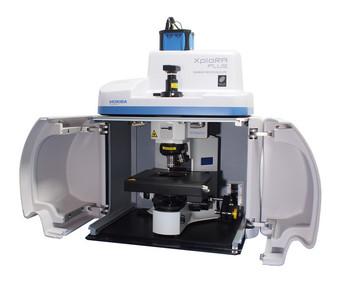
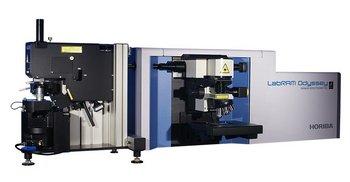
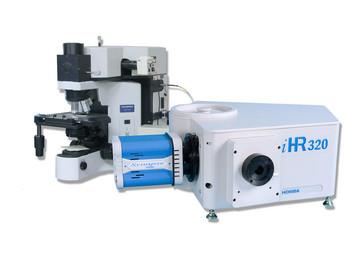
Multimodal Confocal imaging in a compact footprint
LabRAM Soleil™ offers great variety of optical viewing modes and hyperspectral imaging features in a compact and laser safe design:
- < 1m² footprint
- Large Class 1 sample compartment
- Reflection (episcopic) /transmission (diascopic) illumination
- Imaging in optical microscopy bright field/dark field
- ViewSharp 3D Topography
- QScan™ high quality scanning technology for 3D confocal imaging with Laser light-sheet illumination - mapping without moving
- XYZ 3D confocal imaging, Z-profile (single-point or layer by layer with QScan™ option)
- Super-low frequency (30 cm-1) Raman scattering as standard
- Photoluminescence (PL), electroluminescence, photocurrent
- Nanoscale spectroscopy: NanoRaman (TERS), NanoPL, and Cathodoluminescence with our AFM and SEM extensions
Focus on your job, it takes care of the rest!
Forget long and tedious preparation operations before getting your Raman image. LabRAM Soleil™ offers advanced automated functions and, in combination with the EasyImage™ wizard, it dramatically reduces parameter setting time and ensures maximum stability and reproducibility:
- True self-operating system
- EasyImage™ guided operation wizard
- Auto-alignment: automatically check and readjust the alignment within a few seconds according to environmental conditions
- SmartID™: no more risk to use the wrong objective or wrong parameters
- Remote maintenance
Ultrafast imaging: Raman imaging has never been so fast!
Due to a higher optomechanical stability, advanced and patented video Raman matching technology, LabRAM Soleil™ makes possible high-quality Raman imaging up to 100 times faster than a conventional Raman spectrometer.
- SmartSampling™: New mapping algorithm, acquiring most contributive points first, is turning hours maps into minutes.
- TurboDrive™: Fast grating turret drive - up to 400 nm/s
- 4 different SWIFT™ functions:
- SWIFT™
- SWIFT™ XS: Ultra Mode: Fast Raman imaging: up to 1400 spectra/s - High Contrast Mode: fast readout rates and enhanced signal
- SWIFT™ XR: Fast large spectral range acquisitions using Multi Windows mode
- Repetitive SWIFT™: Continuously improve the S/N ratio over time
Facing all analytical challenges:
From materials studies to polymers, and biological to pharmaceutical laboratories, LabRAM Soleil™ can be easily adapted for each application. Its advanced modularity and flexibility makes it a perfect Raman microscopy system, for both academic research laboratories and industrial quality control departments.
- Up to 4 internal lasers and 6 different filters
- 4-grating turret exchangeable in less than a minute
- Super-low frequency as standard: down to 30 cm-1 Raman shift
- Large sample compartment: 444(H) x 509 (L) x 337 (W) mm
- High robustness and simplified maintenance operation
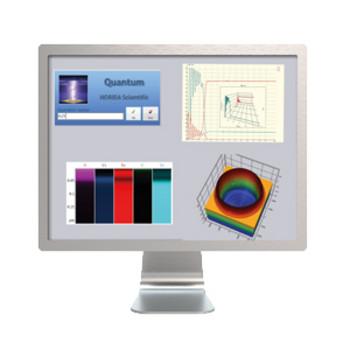
LabSpec6 software: harness LabRAM Soleil™ full power with ease!
LabSpec 6 software offers a great modularity with the exclusive LabStore Apps. Any user can configure his software according to his own needs. Efficiency and performance are combined with ease-of-use. The modern and intuitive design of the software makes it easier than ever to achieve a perfect Raman image. No need to be an expert anymore.
- Advanced Multivariate analysis MVAPlus™ : Process megapixel datasets with ease and maximum accuracy for molecule identification and quantitation, even with “difficult” samples
- ProtectionPlus ensures compliance with FDA 21 CFR Part 11 and GMP/GLP requirements
- ParticuleFinder™ automatically combines morphological and chemical analysis to classify particles in seconds
- EasyImage™ automated workflow to obtain Raman image in a single click


.")


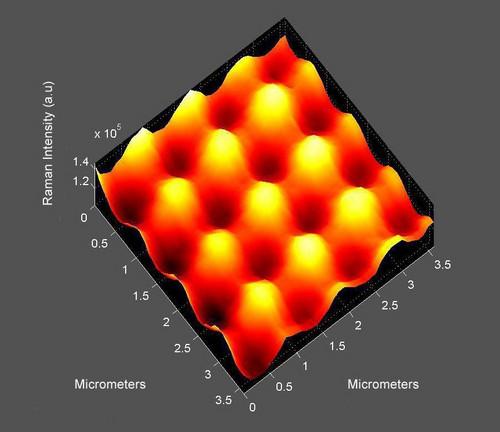


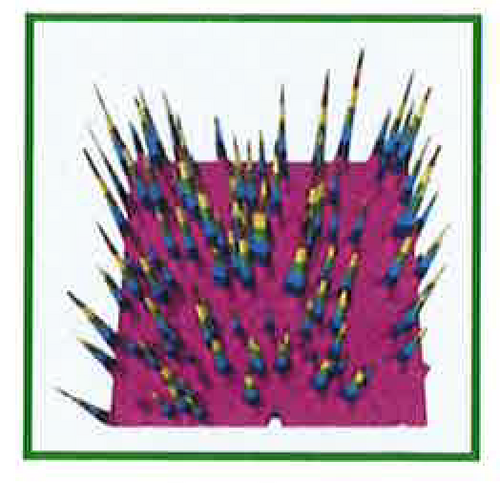


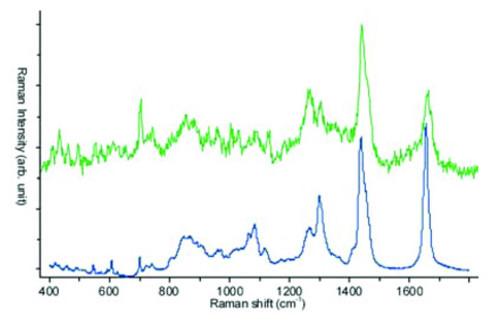
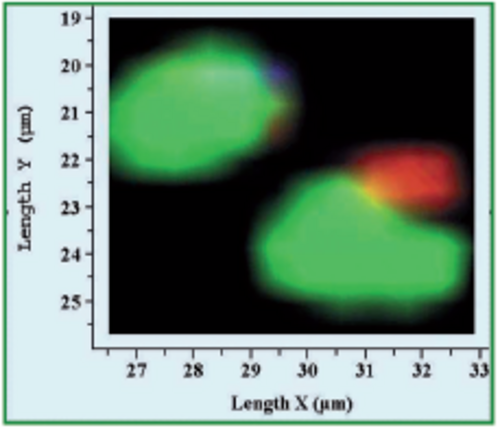
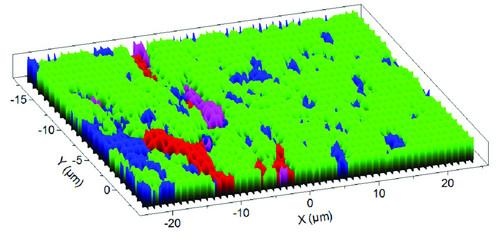
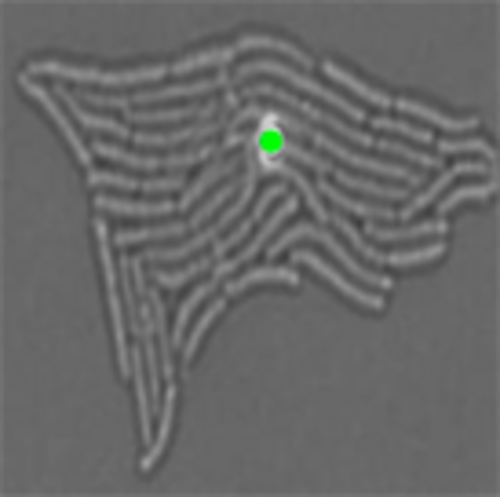
 Raman map of MoS2 layers.")