
Soil and sediments scientists have long understood the importance of particle size distribution to their field. Practically every aspect of soil water flow, carbon and nitrogen content, acidity, aeration, and nutrient availability is related to particle size.
Various approaches have been developed to classify samples into formats useful for categorizing samples and predicting behavior. Some soil scientists classify soil particles into sand, silt and clay, and the relative quantities are used to define the texture of a sample. Sizes of soil separates according to the U.S. Department of Agriculture (USDA) classification system are as follows:

Figure 1. USDA soil classification system
Analysis and classification of the sample can be used to create a texture triangle as shown below:

Figure 2. Soil texture triangle, showing the 12 major textural classes, and particle size scales as defined by the USDA.
Soil fractions give specific characteristics to the soil. Clay improves the nutrient holding capacity, increases water retention, soil stability, but is sometimes difficult to till. Soils high in sand characteristically have good drainage, aeration, and are relatively easy to till. Soils high in silt will be intermediate.
Another approach to classifying soil and sediment samples uses the Phi scale – see below:

Figure 3. The Phi Scale is a sediment particle size scale, defined as a logarithmic transformation of the geometric Udden-Wentworth grain size scale.
Particle size information of sediments can also be used in conjunction with current velocity data to predict whether the sample is more likely to deposit in the river bed or be transported downstream. The Hjulström diagram shown below is used for this kind of prediction.

Figure 4. Hjulström diagram
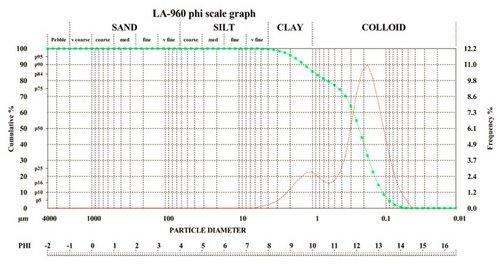
Historically, soil measurements are tediously done through sieving and rototap (not useful for clay size fractions), gravimetric analysis, or pipetting methods. These options are time-consuming and unfit for bulk soil analysis. For these reasons, research institutes use laser diffraction, an automated particle size analyzer based on calibration with USDA to measure a range of soil and sediment applications. The LA-960V2 Particle Size Analyzer is uniquely qualified for soil and sediment samples since the dynamic range of 0.01 – 5,000 micron - broadest of any system available.

Figure 5. LA-960V2 phi scale graph transformation from laser diffraction particle size analysis
Join Dr. Scott Werts, an Associate Professor of Geology at Winthrop University, as he shares his research focusing on utilizing various aspects of soil chemistry and particle size to investigate long-term carbon sequestration in soils, heating in soils from surface fires, and geomorphology and stable isotope composition of peat cores for paleoclimate studies:
Laser Scattering Particle Size Distribution Analyzer
Laser Scattering Particle Size Distribution Analyzer
Do you have any questions or requests? Use this form to contact our specialists.