Integrated Software for Data Acquisition and Analysis Sample Handling
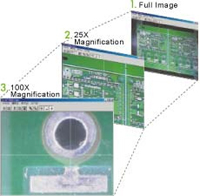
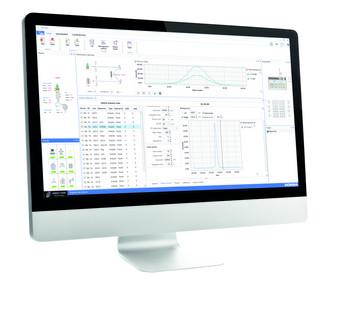
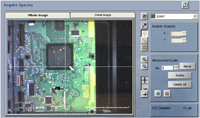
Quickly proceed from a view of the entire sample to the selection of the analysis potision.
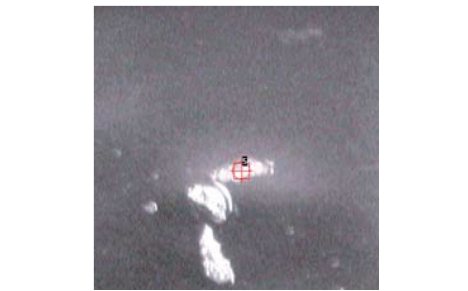
Intuitive "click and move" images from low magnification and high magnification cameras within the sample chamber, allow the analysis position or mapping area to be defined withing seconds.
Acquisition Functions
Single Point and Multi-point Analysis

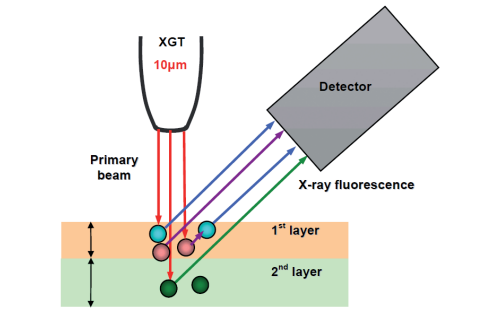
Single point and automated multi-point analyses allow high quality spectra to be acquired from either a single position, or from a number of user defined points across the sample. Element peaks are automatically located and labelled, and quantitative analysis down to ppm levels can be carried out using the fundamental parameters method (FPM), FPM with single standard, and full standard sample calibration.Thickness calculations can also be made on nm and µm thick multi-layered structures.
- Single Point
- Grid Analysis
- Line Analysis
- Multi-Point Analysis
- User Selected
- Coordinate File
- Import with Positional Referencing [option]
- Hyperspectral Mapped Imaging
Mapping Analysis
Hyperspectral Mapping Analysis

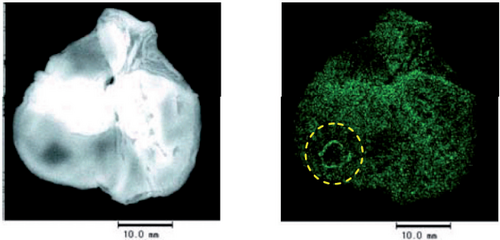
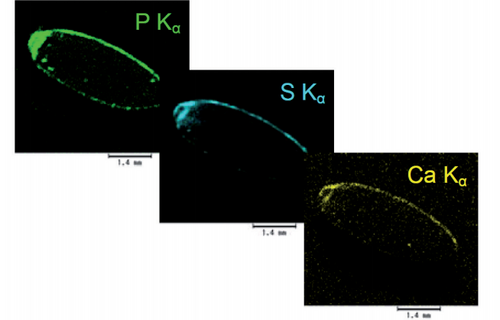
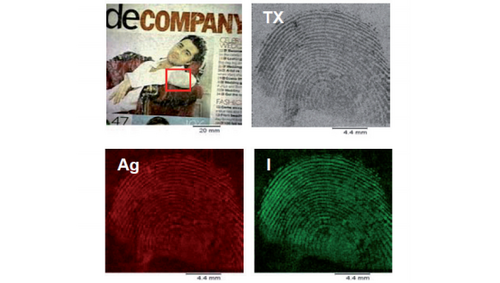
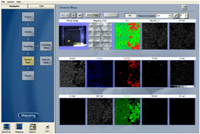
The SmartMap imaging software records a full EDXRF spectrum at each and every pixel of the element image, enabling post-acquisition element image generation and comparison, and spectrum generation from user defined regions in the image with subsequent qualitative and quantitative characterisation.
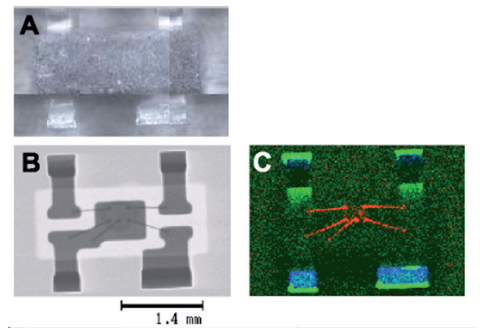
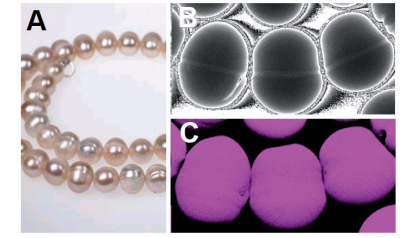
Transmitted X-ray imaging provides additional insight into a sample’s structure, allowing features invisible by eye to become immediately apparent.
Element image display
Element images to be displayed can be selected during and after acquisition. Images can aslo be generated from user defined spectral windows.
RGB Composite Image Generation
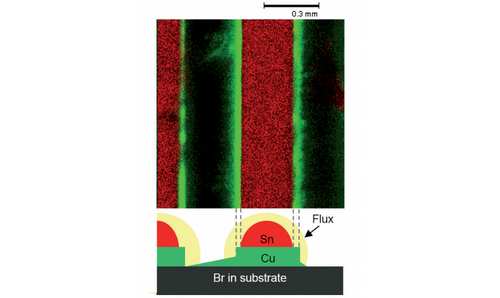
Overlay elemental images to allow easy comparison of element distribution
Spectrum Generation
Generate the average spectrum from a user defined region within an image.
Line Analysis
Display multiple element intensity profiles across a defined region of an image.
Data Export
Element images can be exported in data or image formats. The entire hyperspectral datacube can be exported in RAW format.
Spectrum Analysis
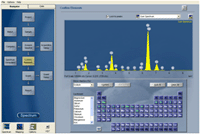
- Peak auto-ID
- Quantitative modes
- FPM
- FPM + Single Standard
- Calibration
- Spectrum overlay and compare
- Multi-layer thickness
- Spectrum matching
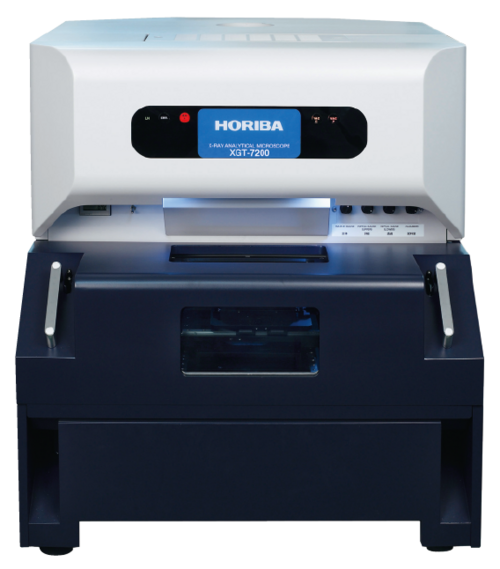
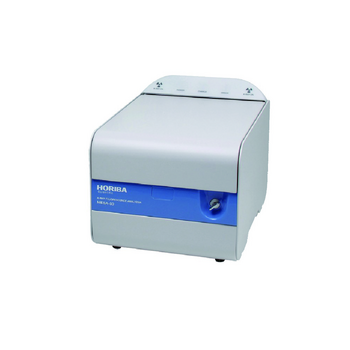
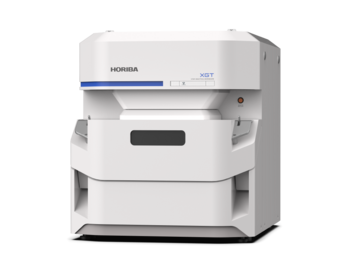
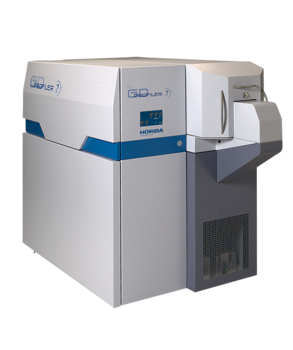
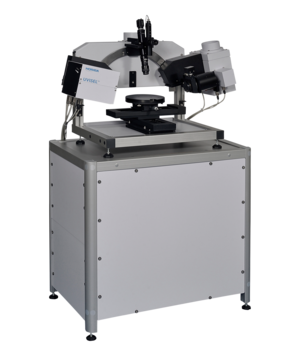
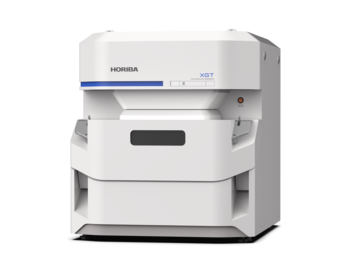
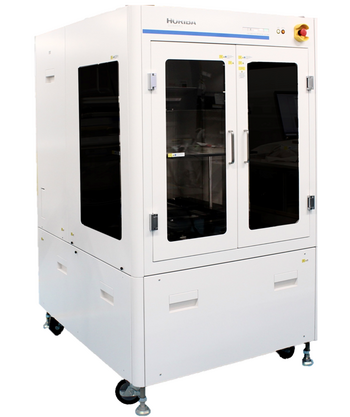
The unique features of the XGT-7200 have seen this innovative micro-XRF analyser widely embraced for a range of applications, including electronics, engine wear analysis, forensic science, geology, mineralogy, pharmaceutics, museums, metallurgy, biology, medicine and archaeology.
The flexible XGT-7200 micro-XRF system covers everything from macro analysis, for a general survey of a wide area, to the inspection of a specific micro area, with simultaneous XRF and transmission imaging. Its many features ensure high performance analysis with easy operation.
- Highest spatial resolution

The unique x-ray guide tube technology of HORIBA provides the highest spatial resolution micro-XRF analysis, with x-ray beam diameters down to 10 µm. The high intensity, ultra-narrow beams provided by the guide tubes allow fast, non-destructive analysis of microscopic features.
- Transmission X-ray Mapped Imaging

In combination with XRF imaging, the XGT-7200 allows transmitted X-ray images to be acquired. This can be used to perform internal structural analyses and identify regions of interest not visible to the eye. Scanning is done with a narrow perpendicular beam, resulting in clear penetrating images even for non-flat samples such as cylindrical parts.
- Dual Vacuum Modes
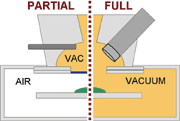
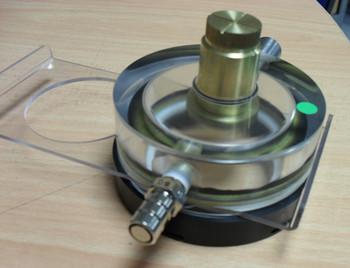
The XGT-7200 system offers the user unique Dual Vacuum Modes for sample analysis – switching between the two modes takes just a few seconds. In Full Vacuum Mode the entire sample chamber is subjected to vacuum conditions to ensure the ultimate sensitivity to light elements. In Partial Vacuum Mode the sample is maintained at atmospheric pressure whilst a vacuum is drawn around the detector and capillary optics. This mode is ideally suited for analysis of water containing samples such as biological tissue, and fragile archaeological/museum objects.
- Complete range of sample sizes
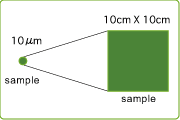
The accommodating sample chamber enables a wide range of samples to be analyzed, from a 10 µm spot analysis on a microscopic feature, to mapped analysis of areas as large as 10cm x 10cm.
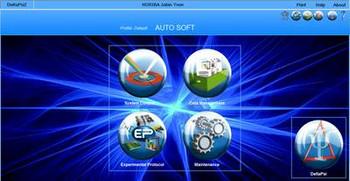
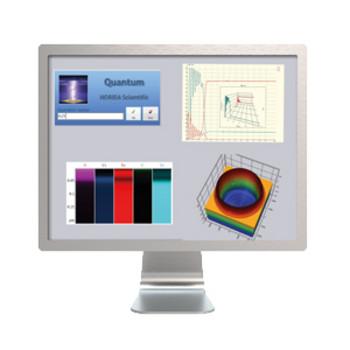
- Integrated Data Acquisition and Analysis Software
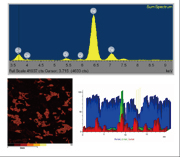
Intuitive software allows easy control of instrument hardware, fast sample visualization and selection of measurement region, and full data analysis. Functions include automated peak identification, quantitative measurements, RGB composite image generation, line profile analysis.

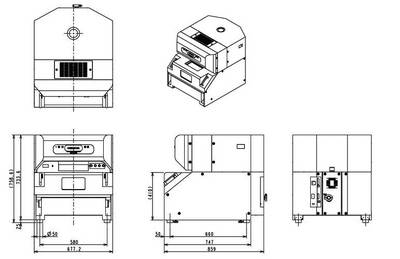
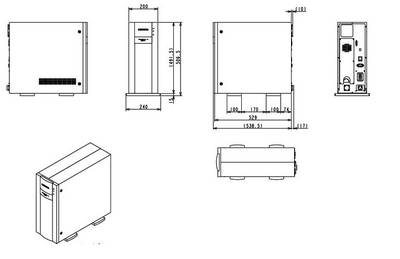
 This product has been discontinued and is no longer available. You can still access this page for informational service purposes.
