Surface Plasmon Resonance imaging (SPRi) is a label-free optical detection technique used to monitor and analyze biomolecular interactions in real time. The imaging capability enables users to visualize the entire working area and work in a multiplex format.
Multiplexing means that different types of ligands can be immobilized on a single SPRi-Biochip. It also enables the study of many parameters at the same time (concentration, immobilization pH, etc.), making it possible to compare, rank and select molecules easily.
Our technology measures modifications of the refractive index at the surface of the SPRi-Biochip, which can be correlated to mass variations. It can be used to detect interacting molecules in real time, to determine the analyte concentration, and the affinity of the interaction.
SPRi allows the full characterization of biomolecular interactions (specificity, kinetics and affinity) which in turn can give information on a sample solution (quantity of molecules).
A vast library of samples can be analyzed. They include proteins, peptides, nucleic acids, carbohydrates, bacteria, cells, polymers, organic small molecules, and more.
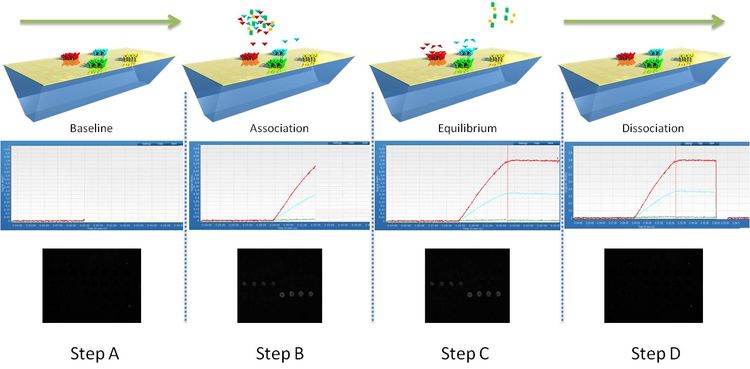
SPRi is used to monitor changes of the refractive index occurring at the surface of the SPRi-Biochip. A binding event, or mass accumulation, will induce a change of refractive index and a shift of the position of the resonance angle. SPRi follows the variations of reflectivity occurring at a fixed angle (working angle) versus time. The principle is described in the following diagram:
Fig.1: Monitoring of molecular interactions by SPRi.
Step A:
The ligands are immobilized in an array format on the functionalized SPRi-Biochip surface.
Step B:
When the sample solution is injected in the flow cell, molecular binding can occur. This induces a shift of the plasmon curves and an increase of reflectivity. The kinetic curves (sensorgrams) show the variations of reflectivity versus time (association phase). The process can also be monitored on the SPRi difference image. White spots correspond to interacting areas of the SPRi-Biochip.
Step C:
When the sample solution leaves the flow cell, the ligand-analyte complexes dissociate. This induces a shift of the plasmon curves and a decrease of reflectivity. The kinetic curves show the variations of reflectivity versus time (dissociation phase). The process can also be monitored on the SPRi difference image as interacting spots become darker.
Step D:
When all the ligand-analyte complexes are fully dissociated (sometimes using a regeneration solution), the plasmon curves and the kinetic curves return to the initial state. The SPRi difference image is black again.