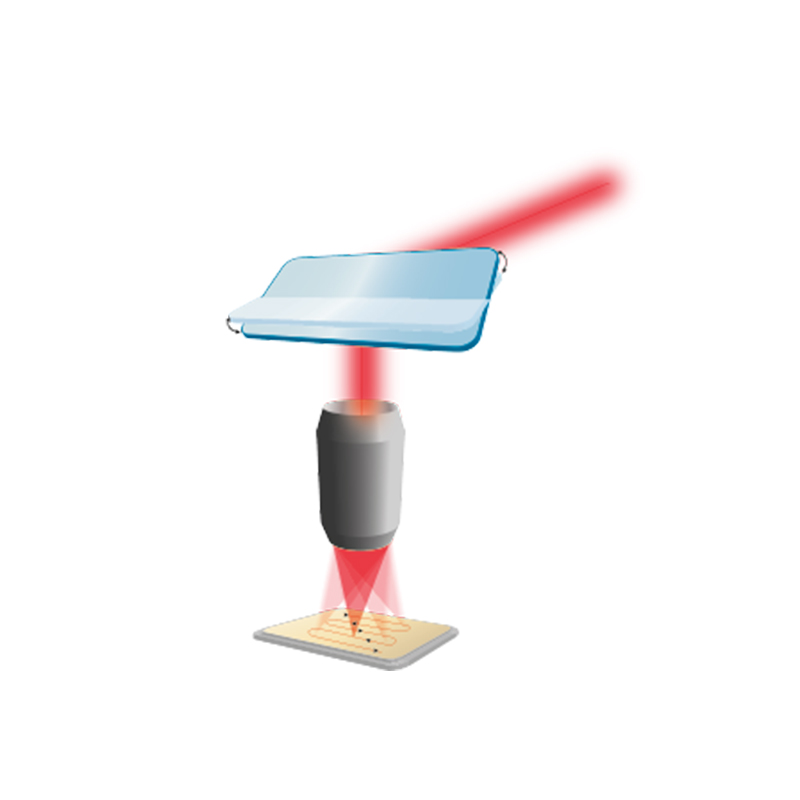
- Fast and uniform scanning over both small and large areas
- Map area in step-by-step mode: 30 µm x 30 µm with a 50X microscope objective
- Compatible with true confocal microscopes for high axial resolution
- Operating spectral range from 220 nm to 1600 nm
- Scanning step sizes down to 50nm
DuoScan™ Macro and Sub-Micron Raman Mapping
Raman Accessory for fast imaging
The DuoScan™ technology enables the ultimate flexibility for Raman imaging, including easy sub-micron Raman imaging, adjustable laser spot sizes, and 100% coverage of a sample for macro-mapping.
The innovative DuoScan™ Imaging system extends the imaging capabilities of HORIBA’s Raman instruments from sub-micron to macro-scale mapping. Generating confocal images becomes faster, easier and more flexible, from the deep UV to the IR.
The DuoScan™ Imaging technology available on the instruments of the LabRAM Series introduces a new imaging mode, based on a combination of scanning mirrors that scan the laser beam across a pattern chosen by the operator: a line for linear profiles, or an area for two-dimensional mapping. It can be used to generate a rastored "macro laser spot" for large area mapping; alternatively, its 50 nm step piezo controllers are ideally suited for Raman mapping of sub-micron features.
How DuoScan works – the three modes
- Averaging mode
In averaging mode the laser spot is continuously scanned across a user-defined square surface
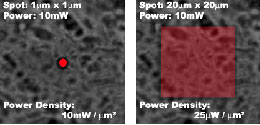
Comparison between standard point measurement and DuoScanTM averaging mode with corresponding laser spot size and power densities on sample
2. Step-by-Step mode
In step-by-step mode a sample area is selected and the sample is scanned point by point across the chosen area.
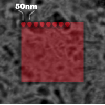
Mapping without moving the sample with 50 nm step size
3. Macro-mapping mode
Macro-mapping mode enables large sample surfaces to be raster-scanned to record an average spectrum across the whole surface, ideal for component distribution or to locate contaminents.
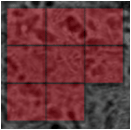
Macro-mapping with full sample coverage using DuoScanTM with motorized stage
DuoScan™ Application Examples
Example 1 – Pharmaceutical Tablet
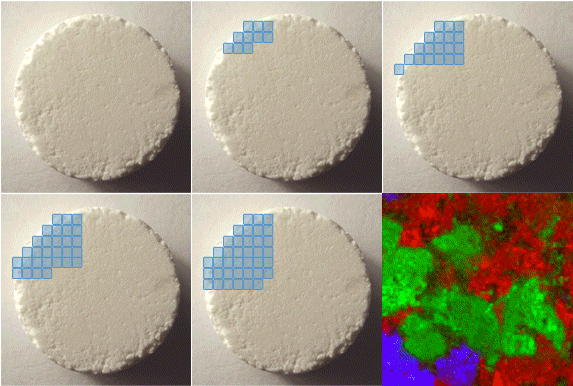
In this example a 12.5 mm by 12.5 mm pharmaceutical tablet is analysed using a DuoScan™ macro-pixel for fast large area mapping – this ensures that the entire surface area of the tablet is analysed, without ‘stepping over’ any small features. Subsequently high resolution point-by-point mapping using the DuoScan™ piezo controlled mirrors allows a detailed image of microscopic features to be visualised.
Example 2 – Carbon Nanotubes
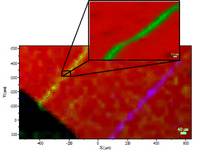
Isolated SWCNTs aligned on a Silicon sample. The colors correspond to the integrated intensity of the Si band (red) and of the respective G bands of the CNTs (green and blue).
DuoScan™ was used in macro-mapping mode to find the isolated CNTs. A high-definition image of the CNT was then obtained with DuoScan™ in step-by-step micro-mapping mode. The apparent width of the CNT is a convolution of the tube diameter with the laser spot size.
Sample courtesy of Dr Kalbac, Heyrovský Institute, Prague, Czech Republic
Other applications
Large area component mapping (contaminant screening, survey scans, etc.)
Chemical imaging at sub-micron scale
Raman analysis and imaging of photosensitive biological samples
Mapping on large and heavy samples that cannot be moved easily
Prevention of photodegradation of organic materials when working with UV excitation
