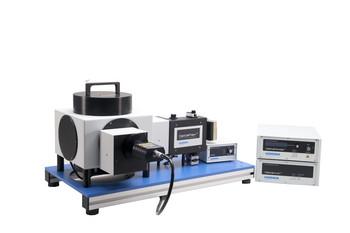
FluoroMax Plus

FluoroMax Plus Sensitive, Flexible, Trusted Spectrofluorometer

Steady State and Lifetime Benchtop Spectrofluorometer

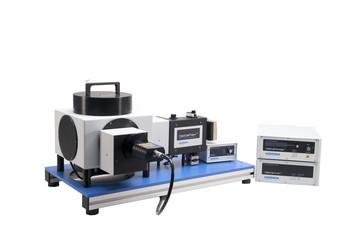
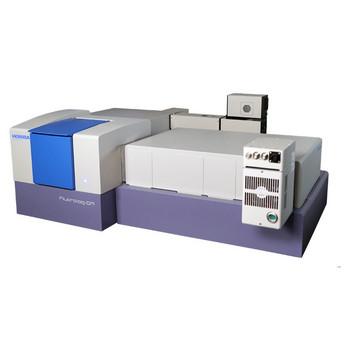
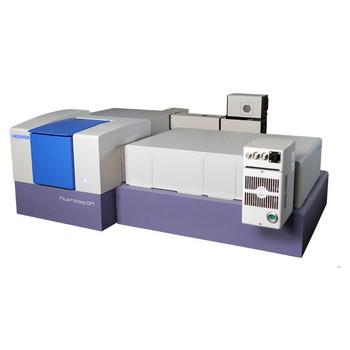
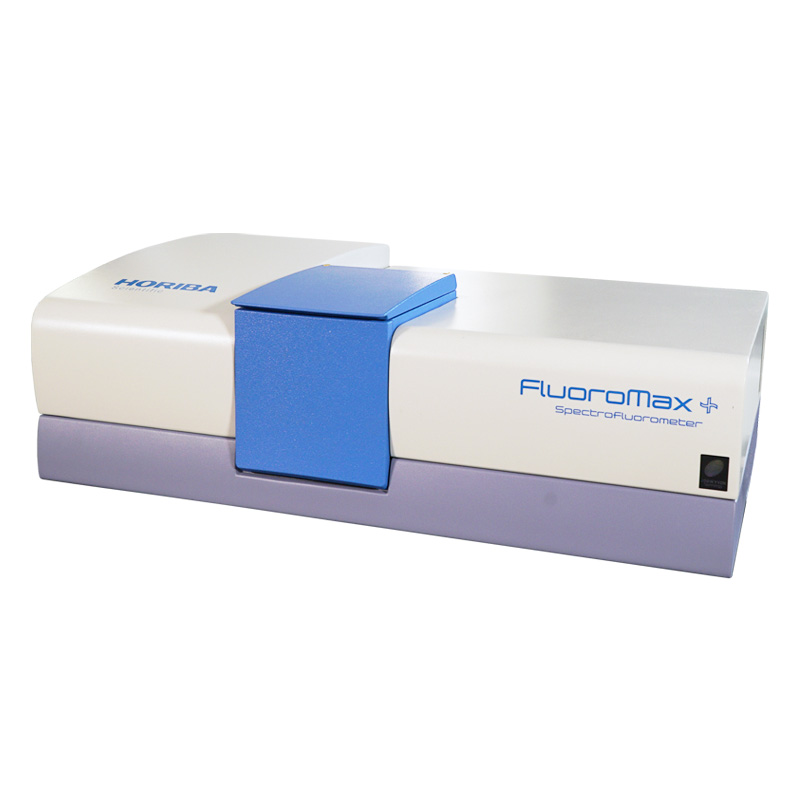
The FluoroMax® Plus represents HORIBA's industry-leading fluorometer performance in a convenient, affordable, easy-to-use benchtop model. The FluoroMax family, with its unique all reflective optics and photon counting was the first to bring the sensitivity of a modular fluorometer to a tabletop fluorescence instrument, in the 1990's.

It’s a compact spectrofluorometer, yet offers the ultimate sensitivity in fluorescence investigations as well as features not found in most table-top fluorescence detection systems.

The FluoroMax Plus is the latest generation of the original, high performance tabletop fluorometer, which offers extended performance with detection of emission spectra out to 1700 nm and (TCSPC) Time Correlated Single Photon Counting lifetime measurements as short as 25ps.

FluoroMax Plus spectrofluorometers are the most senstive, flexible and trusted benchotop spectrofluorometers in the world.

   Science in Action Series   Spectroscopy Matters Series

    Segment: Scientific
    Manufacturing Company: HORIBA Scientific

    Featured Videos


    Features

    • Water Raman signal-to-noise ratio: 10,000:1 (FSD method)
    • Photon Counting for Ultimate Sensitivity
    • Fast Scanning capability - up to 80 nm/second
    • Powerful FluorEssence™ software for Windows®
    • Method Files to recall complete experiment parameters
    • Time-correlated single-photon counting (TCSPC) accessory for lifetime determinations
    • Phosphorimeter accessory for long-lived luminescence determinations

    Hardware

    The Source

    The xenon source that supplies prime UV performance is focused onto the entrance slit of the excitation monochromator with an elliptical mirror. Besides ensuring efficient collection, the reflective surface keeps all wavelengths focused on the slit.

    As an option an additional, software-selectable, xenon flash lamp can be fitted to enable phosphorescence studies.

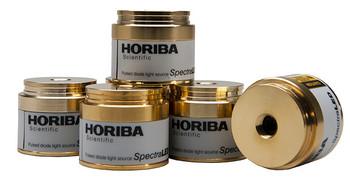
    Optional Pulsed Laser and LED Light Sources.

    The Slits

    The slits themselves are bilaterally, continuously adjustable from the computer in units of bandpass or millimeters. This preserves maximum resolution and instant reproducibility.

    The Excitation Monochromator

    The excitation monochromator is an aspheric design which ensures that the image of the light diffracted by the grating fits through the slit. The gratings themselves are plane, blazed gratings that avoid the two major disadvantages of the more common concave holographic gratings: poor polarization performance and inadequate imaging during scans that throws away light. The unique wavelength drive scans the grating at speeds as high as 80 nm/s. The grating grooves are blazed to provide maximum light in the UV and visible region.

    The Reference Detector

    Before the excitation light reaches the sample, a photodiode reference detector monitors the intensity as a function of time and wavelength. The photodiode detector has a wider wavelength response than the older, traditional rhodamine-B quantum counter, and requires no maintenance.

    The Sample Chamber

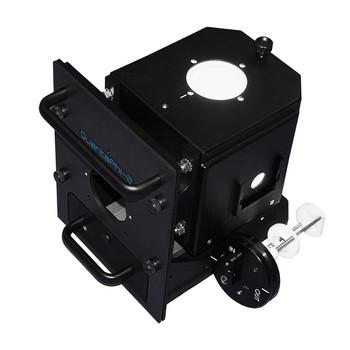
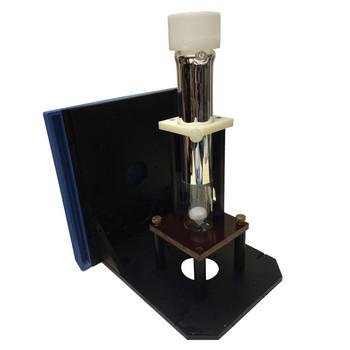
    A spacious sample chamber is provided to allow the use of a long list of accessories for special samples, and encourages the user to utilize a variety of sample schemes.

    The Emission Monochromator

    All the outstanding features of the excitation monochromator are also incorporated into the emission monochromator. Gratings are blazed to provide maximum throughput in the visible region.

    The Emission Detector

    Emission detector electronics employ photon-counting for the ultimate in low-light-level detection. Photon-counting concentrates on signals that originate from fluorescence emission, ignoring smaller signals originating in the detector tube (PMT). The more common method of analog detection (used by lower performance fluorometers) simply adds noise and signal together, masking weak emissions.

    The emission detector housing also contains an integral high-voltage supply which is factory set to provide the signal-to-noise ratio.

    Computer Control

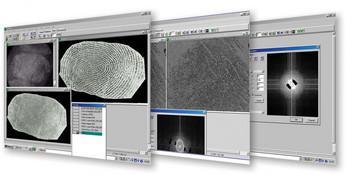
    The entire control of the FluoroMax originates in your PC with our FluorEssence™ software and is transmitted through a USB link. On start-up, the system automatically calibrates and presents itself for new experiments, or stored routines instantly called from memory.

    Accessories

    A wide variety of accessories are applications-oriented and most are interchangeable with the FluoroMax system.


    FluorEssence Steady State Software

    FluorEssence - Steady State Software
     

    FluorEssence™ for Windows® sets a new standard for fluorescence software. FluorEssence™ merges spectrofluorometer data-acquisition directly to the famous processing power of Origin® software.

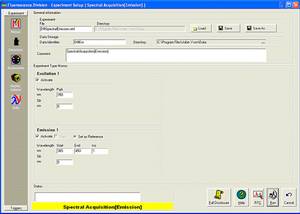
    Simple clicks let you select a scan type, accessory or bring back a complete experimental set-up.

    Revolutionize the Way You Operate Your Spectrofluorometer:

    • Simplified windows make data-acquisition intuitive even to the casual user.
    • With detector algebra, assemble input signals from different detectors into unique equations (including arithmetic or transcendental functions) that produce data in a format tailored to your application.
    • Select the special Real Time Control (RTC) window to optimize your run parameters before actually scanning.
    • Free video tutorials make FluorEssence™ even easier to learn.
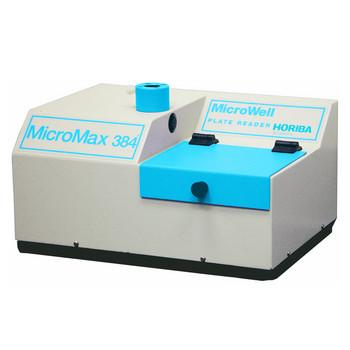
    • Run a variety of accessories including polarizers, microwell-plate readers, temperature baths, autotitrators, phosphorimeters, and more.
    • Automatic correction for blanks and lamp output.
    • Change units for temperature, wavelength, and slit-width with the click of a mouse.


    FluorEssence™ also includes the powerful processing and data-management tools of Origin® to streamline your laboratory’s operation.

    Data-viewing, plotting, processing and management are all available, including extensive import and export facilities, view manipulation and creation, arithmetic applications, peak-picking and integration, data- management and much more!
     

    Software Features

    • Data views in Workbook formats, keeping graphs, tables and notes together for each experiment
    • Zooming and scaling
    • Contour maps and profiles from 3D plots
    • Integration/DerivativeFit fluorescence data to Gaussian, Lorentzian, and custom curves
    • Standard arithmetic
    • 3D perspective
    • Smoothing
    • Deconvolute
    • Excitation/emission correction
    • Interpolation and extrapolation
    • Blank subtraction
    • Normalization
    • PLQY calculator wizard (for use with Quanta-Phi accessory)


    DAS6 Decay Analysis Software
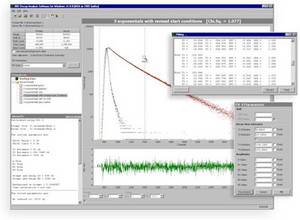
     

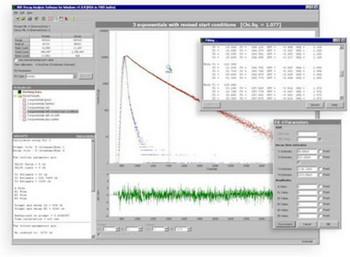
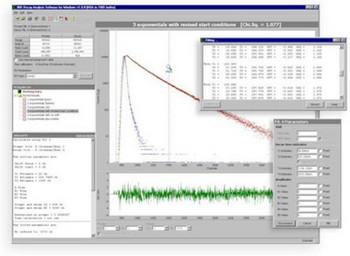
    HORIBA Scientific decay analysis software recovers kinetic information (such as fluorescence lifetime and rotational correlation times) from luminescence decay data by fitting the raw decay data to one of a selection of kinetic models. Features such as shift iteration and reconvolution of instrument response function (IRF, or "lamp" profile) allow accurate recovery of multiple decay components even when the decay data is grossly distorted by the IRF.

    DAS6 is designed to streamline the analysis of time-domain luminescence data, while still allowing for fine-tuning of parameters where necessary.  Analysis modules include reconvolution analysis of multi- exponential models plus analysis of more specialised fluorescence decay processes as detailed below.

    Multi-Exponential

    Analysis for up to 5 exponentials.

    Batch Exponential

    Batch mode supports datasets containing up to 10,000 decays and is ideal for applications where large amounts of lifetime data are generated e.g. lifetime imaging and reaction monitoring.  It features full reconvolution with up to five exponentials and shift iteration.

    Global Exponential

    Perform global analyses of up to 5 exponential components and 100 decay curves.

    Distribution

    Two methods are available for performing lifetime distribution analysis.  The first method employs a “Top Hat” distribution function which allows a single lifetime distribution to be fitted in conjunction with an additional discrete lifetime.  The second method is an optional module which will perform a Non-Extensive Decay distribution which allows up to five lifetime distributions to be modelled.

    Exponential Series

    Exponential series analysis of up to 30 terms.  This allows parameterisation of otherwise difficult data.

    Foerster Energy Transfer

    2D and 3D Foerster type energy transfer with an optional exponential component.

    Yokoto-Tanimoto Energy Transfer

    Yokoto-Tanimoto energy transfer taking into account diffusion with an optional exponential component.

    Micellar quenching

    Micellar quenching kinetics can help determine the surfactant aggregation number.

    Exciplex

    Exciplex analysis follows formation of an excited state species.

    Anisotropy analysis

    Impulse reconvolution of up to 2 correlation times and 5 fluorescence decay components.  Each model parameter, including shift, can be fixed at a pre-determined value or optimised as part of the parameter fitting.  The use of reconvolution allows accurate determination of decay times and rotational correlation times even when the observed decay is grossly distorted by the duration of the excitation pulse.


    DataStation TCSPC Acquisition Software
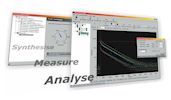
     

    DataStation is the latest measurement environment for time-domain fluorescence and is supplied with all HORIBA Scientific lifetime systems.

    Lifetime systems are made up of various modules and components, including pulsed light sources, PMTs, monochromators, motorized polarizers, focusing optics, MCAs etc. DataStation integrates the control of all these components into one intuitive, mouse-driven Windows environment.

    Lifetime systems can perform a variety of measurement functions, such as fluorescence decay measurement, phosphorescence decay measurement, time-resolved anisotropy measurements, steady-state spectra, time-resolved emission scan (TRES), temperature scans and more. These measurements are now routine using DataStation. Measurement templates are provided to quickly set up the instrument for the required measurement, and automated data acquisition is performed using computer controlled components.

    Acquired data can be saved in a variety of formats including the .das format, HORIBA Jobin Yvon IBH v4.2, and ASCII, printed to your Windows printer, exported or copied to the clipboard for manipulation using a third-party application.

    DataStation can be purchased separately for use on non-HORIBA Scientific systems, and we are happy to add custom functionality and interfacing (e.g. to additional monochromator types, motorized polarizer holders etc).

    The DataStation software comes into its own when combined with a FluoroHub.

    Functionality

    DataStation evolves continually as new functionality is added in response to customer suggestion. The following is a partial list:

    Graphical

    • Log or linear y-axis.
    • Auto scaling y-axis.
    • Multiple mouse zoom modes - x only, y only, x and y, pan, reset.
    • Reversed time-axis mode (automatically reverses data during reversed-TAC mode measurements).
    • Live display of cursor position, peak count, peak channel and total count.
    • Detachable and customizable toolbars with helpful hints.
    • Context-sensitive pop-up toolbars.
    • Intuitive tree navigation for files and hardware settings.
    • Tree navigation control window for FluoroHub control.
    • Real-time estimated average lifetime during acquisition.
     

    TCSPC mode

    • Measurement presets - peak count or elapsed time.
    • Multiple traces on screen simultaneously.

    TRES mode

    • Configure instrument for scan operation in just a few mouse clicks.
    • Scan excitation or emission monochromator.
    • Records 3D data (counts vs time vs wavelength) with live 3D progress display and interactive rotation.
    • Manual and automatic data slicing.

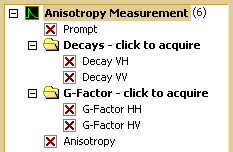
    Anisotropy mode

    • Target difference count.
    • G-factor measurement.

    MCA support

    • Canberra/Tennelec PCA3.
    • EG&G/Perkin Elmer Ortec Trump card.

    Monochromator support

    Polarizer support

    • HORIBA Scientific 5000U-02 polarizers.
    • PRA polarizers.

    Temperature control support

    • HORIBA Jobin Yvon IBH dipstick temperature controller (as accessory to HORIBA Scientific 5000 series system only).
    • Cryostat (as accessory to HORIBA Scientific 5000 series system only).

    System Requirements

    The following PC specification are required to run DataStation. Measurement functionality depends on spectrometer hardware attached. Basic operation requires a supported MCA card or FluoroHub. Contact HORIBA Scientific for more information.

    1 Gb RAM, 1 Gb HD space, DVD drive, 1024x768 graphics with minimum 256 color support, mouse or other pointing device. Windows™ XP or later (XP/Vista/7). Windows™ XP recommended.

    Lamp Vertically mounted, CW, 150 W Ozone-free xenon arc lamp
    Gratings 1200 groove/mm blazed at 330 nm (excitation) and 500 nm (emission), plane ruled
     Automatic self-calibration of all wavelength drives and slits
    Monochromators All reflective optics, Czerny-Turner spectrometers
    Detectors Emission: R928P photon counting PMT (185-850 nm) and reference photodiode for monitoring lamp output
    Water Raman S/N 10,000:1 (FSD method). See Signal-to-noise ratio
    Slits Continuously variable from 0 to 29 nm
    Accuracy 0.5 nm
    Repeatability0.1 nm

    Minimum step

    0.0525 nm

    Integration time

    0.001 to 160 sec

    Software

    FluorEssence

    Spectral Correction Factors

    Included
    Understanding the Relationship Between Molecular Structure and Aggregate Behavior in Nonconjugated Rhodamine Derivatives Unlocks Their Potential in Food Spoilage Detection
    Understanding the Relationship Between Molecular Structure and Aggregate Behavior in Nonconjugated Rhodamine Derivatives Unlocks Their Potential in Food Spoilage Detection
    This application note summarizes a groundbreaking study in the world of food safety and conservation that delves into the aggregation-induced emission (AIE) phenomenon of nonconjugated rhodamine derivatives, sheds light on the underlying mechanism driving their luminescent properties and unlocks their potential in food spoilage detection.
    Fluorescence of Molecular Beacons
    Fluorescence of Molecular Beacons
    Fluorescence measurements with HORIBA Scientific spectrofluorometers are a sensitive tool for probing biochemical interactions such as molecular beacons and DNA.
    Fluorescence Anisotropy Studies
    Fluorescence Anisotropy Studies
    Polarized light striking a fluorescent molecule results in polarized fluorescence. This polarized emission gradually returns to unpolarized fluorescence depending on rotational diffusion and other factors. Anisotropy is directly related to the polarization, and is the ratio of the polarized light component to the total light intensity.
    Photoluminescence Spectroscopy of Quantum Dots
    Photoluminescence Spectroscopy of Quantum Dots
    Quantum dots (QDs) have potential applications in optoelectronics, biosensing, biolabeling, memory devices, and sources of laser light.
    Fluorescence on Small or Solid Samples
    Fluorescence on Small or Solid Samples
    Samples can be valuable. Either you don’t want to waste them, or you may not have very much starting material. Biological proteins and enzymes, for example, are often obtained in small volumes and may be expensive.
    Fluorescence Spectroscopy and Water Quality
    Fluorescence Spectroscopy and Water Quality
    Water travels through the environment carrying dissolved organic matter (DOM), made up of various chemical compounds, which have entered the water column from many sources.
    Recording Fluorescence Quantum Yields
    Recording Fluorescence Quantum Yields
    When a fluorophore absorbs a photon of light, an energetically excited state is formed. The fate of this species is varied, depending upon the exact nature of the fluorophore and its surroundings, but the end result is deactivation (loss of energy) and return to the ground state.
    Fluorescent Pigments in Living Coral
    Fluorescent Pigments in Living Coral
    The brightly-colored coral reefs that make scuba-diving and snorkeling so enjoyable are essential to the survival of much underwater life. Not only do reefs offer a haven for smaller fish to hide from larger predators, but also some fish actually survive by eating the reefs themselves. Reefs offer protection to plants and animals from the ravages of waves and ocean currents. Thus, when the reefs die, so do many other living creatures.
    Characterizing Galvanizing Bath with Fluorescence
    Characterizing Galvanizing Bath with Fluorescence
    Automobile-parts production can be paralyzed by a defective electrongalvanizing (EV) bath line.
    Studying perovskite solar cells with HORIBA Scientific equipment
    Studying perovskite solar cells with HORIBA Scientific equipment
    With their ~20 % efficiency, hybrid perovskite solar cells are the new promising candidate for next generation photovoltaics. Thanks to the wide HORIBA Scientific portfolio, different techniques can be used to gain in depth knowledge on the optoelectronic properties and mechanisms of this class of materials. In this application note we decided to use spectroscopic ellipsometry, steady-state and time-resolved fluorescence and Glow Discharge Optical Emission Spectroscopy to investigate the properties of CH3NH3PbI3 thin films deposited on a spin-coated PEDOT:PSS. The impact of the exposure to air was addressed.
    MCS and Protein Phosphorescence
    MCS and Protein Phosphorescence
    Tryptophan phosphorescence within protein molecules is gaining attention as a probe of protein dynamics and structure. The tryptophan phosphorescence lifetime, τ, varies with the protein molecule’s local environment and conformation.
    Request for Information

    Do you have any questions or requests? Use this form to contact our specialists.

    * These fields are mandatory.

    Product accessories

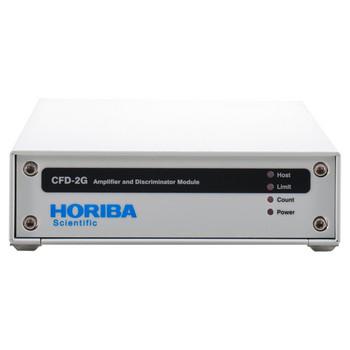
    CFD-2G
    CFD-2G

    Amplifier-Discriminator

    DAS6
    DAS6

    Decay Analysis Software

    FluorEssence
    FluorEssence

    Steady State Software

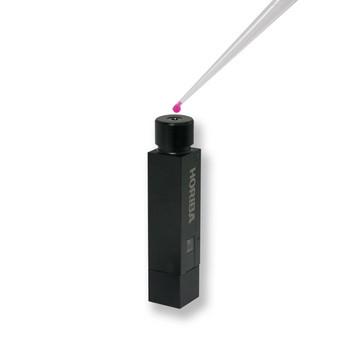
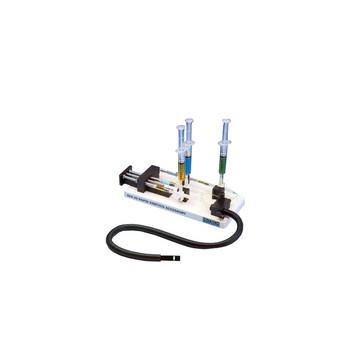
    Microsense microliter fluorescence measurement solution
    Microsense microliter fluorescence measurement solution

    Easy to deposit, easy to recover, easy to clean.

    QuantaPhi-2
    QuantaPhi-2

    PLQY Integrating Sphere

    Rapid Peltier-based temperature-controlled sample holders
    Rapid Peltier-based temperature-controlled sample holders

    Software-controlled for automated temperature dependent fluorescence

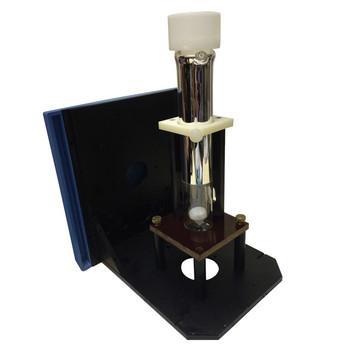
    Solid Sample Tray
    Solid Sample Tray

    Greater Versatility and User Functionality

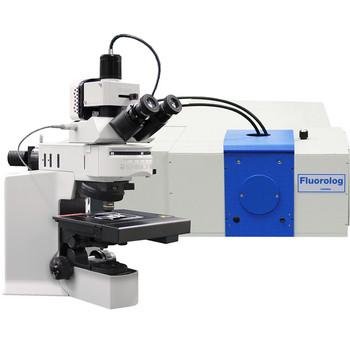
    Universal Fiber Coupling Solution
    Universal Fiber Coupling Solution

    Connect any of our steady state and hybrid fluorometers to virtually any upright or inverted microscope!

    Related products

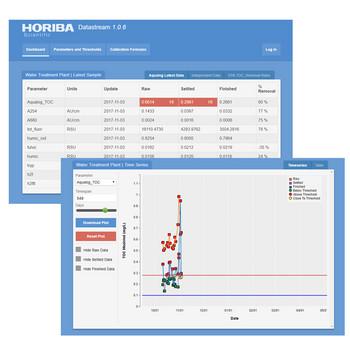
    Aqualog Datastream
    Aqualog Datastream

    For Instant Water Quality Reports

    DeltaFlex
    DeltaFlex

    TCSPC/MCS Fluorescence Lifetime System

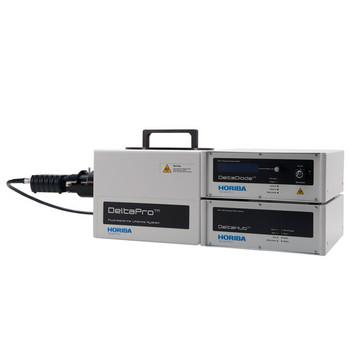
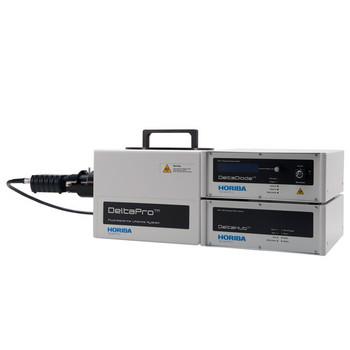
    DeltaPro
    DeltaPro

    TCSPC Lifetime Fluorometer

    Fluorolog-QM
    Fluorolog-QM

    Modular Research Fluorometer for Lifetime and Steady State Measurements

    GD-Profiler 2™
    GD-Profiler 2™

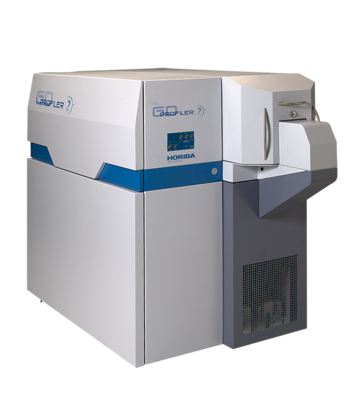
    Pulsed-RF Glow Discharge Optical Emission Spectrometer

    Nanolog
    Nanolog

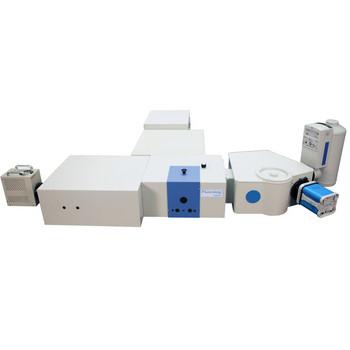
    Steady State and Lifetime Nanotechnology EEM Spectrofluorometer

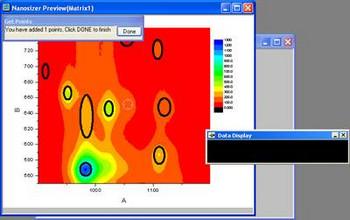
    Nanosizer
    Nanosizer

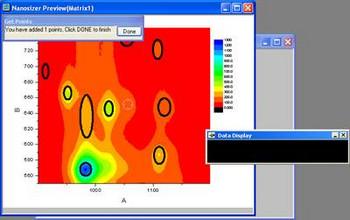
    For Single‐Walled Carbon Nanotube Excitation‐Emission Map Simulation and Analysis

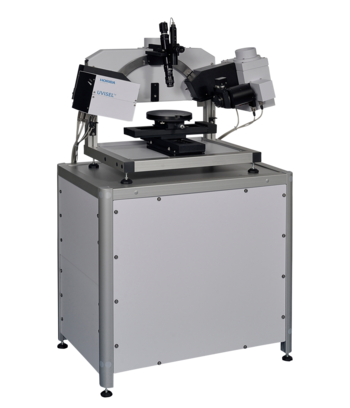
    UVISEL Plus
    UVISEL Plus

    Spectroscopic Ellipsometer from FUV to NIR: 190 to 2100 nm

    CFD-2G
    CFD-2G

    Amplifier-Discriminator

    DAS6
    DAS6

    Decay Analysis Software

    DeltaFlex
    DeltaFlex

    TCSPC/MCS Fluorescence Lifetime System

    DeltaPro
    DeltaPro

    TCSPC Lifetime Fluorometer

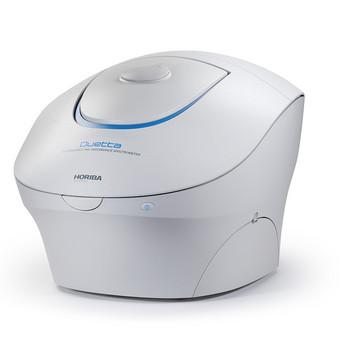
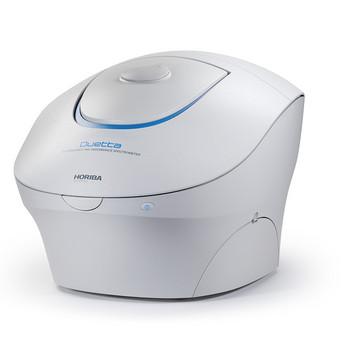
    Duetta
    Duetta

    Fluorescence and Absorbance Spectrometer

    Fluorolog-QM
    Fluorolog-QM

    Modular Research Fluorometer for Lifetime and Steady State Measurements

    Hybrid Picosecond Photon Detector (HPPD) Series
    Hybrid Picosecond Photon Detector (HPPD) Series

    HORIBA’s latest development in TCSPC detector technology

    Nanosizer
    Nanosizer

    For Single‐Walled Carbon Nanotube Excitation‐Emission Map Simulation and Analysis

    PPD Photon Counting Detector
    PPD Photon Counting Detector

    Single photons detection with picosecond accuracy

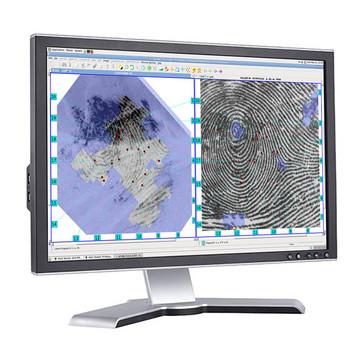
    PrintQuest
    PrintQuest

    Automated Fingerprint and Palmprint Identification - AFIS & APIS Systems

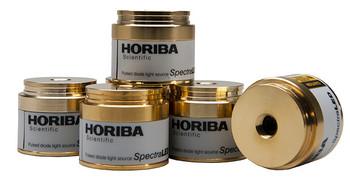
    SpectraLED
    SpectraLED

    LED Phosphorescence Light Sources

    Aqualog - Water Treatment Plant Analyzer
    Aqualog - Water Treatment Plant Analyzer

    Automated Organic Analysis & Early Warning Sentinel

    Aqualog Datastream
    Aqualog Datastream

    For Instant Water Quality Reports

    CFD-2G
    CFD-2G

    Amplifier-Discriminator

    DAS6
    DAS6

    Decay Analysis Software

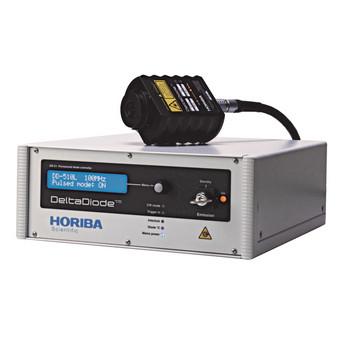
    DeltaDiode
    DeltaDiode

    TCSPC Pulsed Sources

    DeltaFlex
    DeltaFlex

    TCSPC/MCS Fluorescence Lifetime System

    DeltaPro
    DeltaPro

    TCSPC Lifetime Fluorometer

    Duetta
    Duetta

    Fluorescence and Absorbance Spectrometer

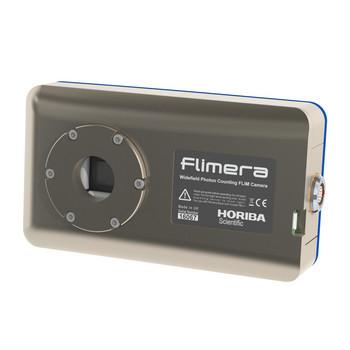
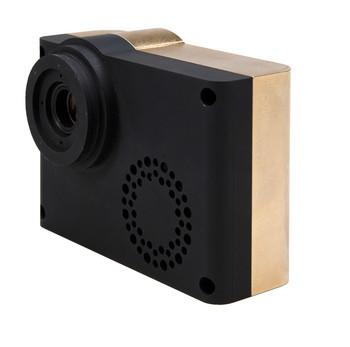
    FLIMera
    FLIMera

    SPAD array imaging camera for dynamic FLIM studies at real time video rates

    Fluorolog-QM
    Fluorolog-QM

    Modular Research Fluorometer for Lifetime and Steady State Measurements

    Hybrid Picosecond Photon Detector (HPPD) Series
    Hybrid Picosecond Photon Detector (HPPD) Series

    HORIBA’s latest development in TCSPC detector technology

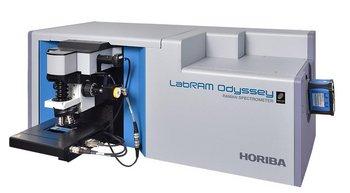
    LabRAM Odyssey
    LabRAM Odyssey

    Confocal Raman & High-Resolution Spectrometer

    LabRAM Odyssey Semiconductor
    LabRAM Odyssey Semiconductor

    Photoluminescence and Raman Wafer Imaging

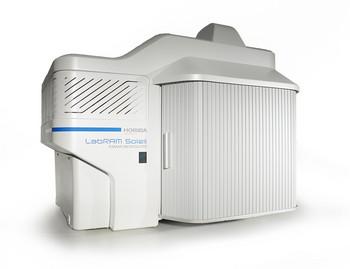
    LabRAM Soleil
    LabRAM Soleil

    Raman Spectroscope - Automated Imaging Microscope

    Modular Raman Microscope
    Modular Raman Microscope

    Flexible Raman System

    Nanolog
    Nanolog

    Steady State and Lifetime Nanotechnology EEM Spectrofluorometer

    Nanosizer
    Nanosizer

    For Single‐Walled Carbon Nanotube Excitation‐Emission Map Simulation and Analysis

    PPD Photon Counting Detector
    PPD Photon Counting Detector

    Single photons detection with picosecond accuracy

    QuantaPhi-2
    QuantaPhi-2

    PLQY Integrating Sphere

    SpectraLED
    SpectraLED

    LED Phosphorescence Light Sources

    Universal Fiber Coupling Solution
    Universal Fiber Coupling Solution

    Connect any of our steady state and hybrid fluorometers to virtually any upright or inverted microscope!

    XploRA™ PLUS
    XploRA™ PLUS

    MicroRaman Spectrometer - Confocal Raman Microscope