
Fluorescence is a highly sensitive analytical technique, so one of the primary specifications to consider when selecting a spectrofluorometer is its sensitivity. The overall sensitivity of a spectrofluorometer is determined by many factors including, but certainly not limited to, the optical design, coupling optics, intensity of delivered excitation light, efficiency of fluorescence collection, spectrometer design, detector technology and much more. For example, a system that has a higher wattage lamp, does not guarantee that it offers better overall fluorescence sensitivity.
Given that there are so many variables that go into making a sensitive fluorometer, what is needed is a standard reference test that can be performed by any user, to properly compare one fluorometer with another.
In the past, some commercial manufacturers of fluorometers used detection limits for specific fluorescent molecules, such as quinine sulfate or fluorescein to demonstrate sensitivity. However, today, the highest sensitivity fluorometers are able to detect at such low concentrations of fluorophores, that the ability to accurately perform a serial dilution down to these detection limits becomes questionable. As such, the water Raman test has become an industry standard as a good measure of the relative sensitivity between different instruments. The water Raman test is also preferable because ultrapure water is readily available around the world, the sample is stable, the signal is relatively weak, and the Raman band of water can be measured over the entire wavelength range of the instrument allowing for more robust comparisons, than is possible with a single fluorescent probe.This sensitivity specification is derived from an emission spectrum of the Raman vibrational band for pure water. Typically it is acquired with the excitation wavelength selected at 350 nm, with an emission scan from 365 to 450 nm. In general, the sensitivity of the fluorometer is expressed in a signal-to-noise ratio (SNR) that is a comparison of a signal value in the presence of a signal, with a value for system noise, in the absence of signal.
Unfortunately, not all manufacturers use the same experimental conditions to acquire this data set, and they also do not use the same formulas for calculating the SNR of the acquired data. There is no right or wrong way to collect data, or analyze it, but it is clear that different methods and analysis can give quite different numbers. Therefore, it is important not only to know how the water Raman spectrum was acquired, but also how the data were treated. If you can ensure the data is acquired and analyzed in the same way, you can be certain to make a fair comparison between two different fluorometers.
In this technical note we point out the different factors influencing the signal-to-noise ratio, and articulate the HORIBA method, to allow investigators to have thenecessary tools to make a proper comparison.
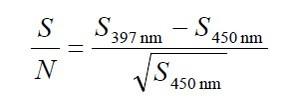
For decades now, HORIBA has defined the SNR as the difference of Peak signal minus Background signal, divided by the square root of the Background signal. We call this the FSD method (First Standard Deviation).
It is also referred to as the square root (SQRT) method.
The FSD signal to noise ratio formula is shown below.

The peak signal is measured at the water Raman peak intensity at 397 nm (for 350 nm excitation) and the noise in a region where no Raman signal is present (450 nm). For a perfect optical system there would be no signal at 450 nm since there is no Raman emission there, however, all electro-optical systems have some levels of stray light and noise, which will contribute to a signal at 450 nm. The above formula assumes that the noise is governed by Poisson statistics and, therefore, can be calculated as the square root of the baseline signal counts at 450 nm. It is only applicable to photon counting detection, so for comparison purposes it should only be used when comparing two photon counting spectrofluorometers.
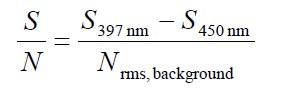
Another commonly used method is to divide the difference of Peak signal – Background signal, by the Root Mean Square (RMS) value of the noise on the background signal. This second method is used by a number of manufacturers, and is the best approach for spectrofluorometers that use analog detectors, where the intensity units will vary from one manufacturer to another.
The RMS signal to noise ratio formula is shown below.

To correctly measure the RMS noise value for the denominator, a second experiment is performed where the fluorometer excites at 350 nm and the kinetics is measured as a function of time at 450 nm emission.
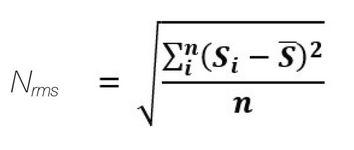
The RMS formula is given by,

Where the time-based background signal is measured n times and S is the average intensity value across the kinetic scan.
Not all companies use the RMS formula above. Some use the peak-to-peak noise of the data off peak, say from 420 to 450 nm, and still others use an RMS estimate,either from the off peak portion of the spectrum, or from a secondary kinetics scan of the peak. In the end, the method for determining the RMS noise isn’t as critical asapplying the exact same formula to any comparisons that one would make.
In conclusion, there is no best way to calculate the signal noise ratio for the Raman band of water, and different companies do it in different ways. The FSD method is valid only for comparing photon counting spectrofluorometers. When comparing one or multiple systems that use analog detection, then RMS, or some RMS estimate method, should be used.
As long as the different data sets are calculating sensitivity in the same way, any particular method will provide a relative measure of the SNR of one spectrum compared to another.
Just as the formula used to calculate the signal to noise ratio can have a dramatic effect on the apparent sensitivity of any particular spectral dataset, the hardware configuration of the instrument, and the experimental parameters of the data acquisition, also have a dramatic effect on the quality of the spectrum acquired.
There are many hardware parameters,settings and options that all have an effect on the measured sensitivity of a spectrofluorometer. This can make it extremely difficult to absolutely compare the relative sensitivity of two different instruments, if they are not used in a virtually identical way. Below we discuss each of these factors and the impact they have on the resulting data.
Excitation Wavelength: The excitation wavelength should be identical for all systems being compared. The HORIBA method uses 350 nm excitation for the Raman band of water, as do most other manufacturers. When exciting at 350 nm, the Raman emission band for water has a peak at 397 nm.
It is fortunate that most manufactures have standardized on this excitation wavelength, as it allows for better comparison. However, it is perfectly valid to move the excitation wavelength to any other value as a way to test sensitivity in a different wavelength range (e.g. the NIR).
Emission Scanning Range: The HORIBA method scans the emission monochromator from 365 to 450 nm, with 0.5 nm increments, so as to collect the entire Raman peak at 397 nm and also the background at 450 nm.
Bandwidth (Slit Size): The HORIBA method uses 5 nm bandpass slits on both the excitation and the emission spectrometers. Some manufacturers specify 10 nm slits which has the effect of increasing the sensitivity compared to 5 nm. It has been reported that doubling the physical slit size at the entrance and exit of a monochromator can quadruple the intensity of excitation and the emission detection throughput since the throughput goes as the square of the size increase,but this a simplistic estimate that should be measured empirically. HORIBA has measured the factor difference with the HORIBA Fluoromax, and observed that for Fluoromax, doubling the slits size from 5 to 10 nm increases the overall signal to noise ratio for the Raman band of water by a factor of more than 3 times. However this will be different for all fluorometers, so please be sure nto compare with identical bandpasses.
Integration Time (or Response Time): This refers to how long the detector is allowed to collect a signal at a given wavelength step position. It also plays a significant role in the overall sensitivity measured for a fluorometer. The HORIBA method uses a 1 second integration time at each wavelength point, similar to other manufacturers. However some manufacturers specify a 2 second response time which increases the overall signal to noise ratio by almost a factor of two. Be sure to use the same integration (response) time when comparing.
PMT Type: Most spectrofluorometers use a photomultiplier Tube (PMT) as their sole detector of fluorescence emission, without any option for changing the detector housing. This is true for most bench-top analytical fluorometers. Some of these bench-top systems allow for the selection of different individual PMT’s with different wavelength ranges and specifications. PMTs that do not detect as far into the NIR as other PMTs will have a lower dark count, so that they will provide a better signal to noise ratio in the 350 to 400 nm range, however they may not be useable in the entire emission wavelength range desired for a particular lab. HORIBA’s standard PMT used in the FluoroMax Plus, Fluorolog3 and QuantaMaster 8000 series of fluorometers, is the Hamamatsu R928P PMT, which is considered the industry standard for fluorometery. In these cases, be sure that each fluorometer is using the same PMT, where possible.
Optical Filters: An optical filter can be added to the optical path of a fluorometer, either on the excitation side or emission side of the sample. These can be manually placed into a filter holder inside the sample compartment, or they can be part of a filter wheel that can automatically place different filters into the optical path when different experimental protocols are selected. Optical filters have the effect of improving the stray light rejection at given wavelengths, and they can dramatically improve the signal to noise ratio of a fluorometer. HORIBA does not use any optical filters, other than the scanning spectrometers themselves, when specifying the SNR for water Raman with the Fluoromax, Fluorolog3 or QuantaMaster 8000 series specifications. When comparing a HORIBA fluorometer, with a fluorometer that uses automated filters, please do not use a filter, or if it is automatic, confirm what make and type of filters are used, and where they are employed, to replicate a similar experimental method with a HORIBA fluorometer.
Detector Type: Modular research fluorometers typically include a PMT housing as standard, but allow for manydifferent types of single channel detectors to extend the wavelength range, or fluorescence lifetime range of an instrument. Alternative detectors include cooled PMT housings, various solid state detectors such as InGaAs, MCP PMT’s and so on. These different types of detectors will have dramatic effects on the signal to noise ratio of any particular sample measurement, so here again, when trying to compare the sensitivity of one fluorometer against another, be sure that the same detector type is used to collect data on both systems.
Detector Temperature: Most commercial spectrofluorometers use PMT housings that are not cooled, and in fact many instruments do not even offer a cooled detector option. A cooled PMT housing can improve the sensitivity of an instrument by reducing the dark counts (background) compared to the same exact PMT in an ambient housing. HORIBA’s standard PMT housings in the FluoroMaxPlus, Fluorolog3 and QuantaMaster 8000 are ambient PMT housings, however the Fluorolog3 and QuantaMaster 8000 series do offer optional cooled PMT housings to improve sensitivity and NIR detection. When comparing modular research fluorometers, be sure to compare data collected with the same type of PMT housing (ambient or cooled), and if cooled, then also cooled to the same temperature.
Single Versus Double Monochromator: Modular research fluorometers allow a researcher to select single or double monochromators on either the excitation or the emission optical path. Here the term double monochromator refers to two dispersive grating stages, one after the other, with an entrance slit, intermediate slit, and exit slit. A double monochromator can be configured either in the additive or dispersive mode, but in either case the throughput and stray light characteristics of a single versus a double monochromator are vastly different, and will have a big impact on the SNR of a water Raman scan, even if the bandwidths, integration times, and wavelengths are all held constant.
Groove Density of Grating: The groove density of a grating will also effect the throughput, and hence sensitivity of a spectrofluorometer. For most spectrofluorometers this isn’t too much of an issue because the systems are manufactured with only one particular grating. In this case the most important thing is to ensure the bandpasses are selected to be the same. However for modular fluorometers, you can configure the monochromators with different gratings, or multiple gratings. For these systems, you must be very careful to keep things as similar as possible. For example when you have two instruments that have similar focal length spectrometers, changing the groove density of the grating will increase or decrease the sensitivity for the same 5 nm bandpass setting. The HORIBA method uses gratings with a grove density of 1,200 grooves per millimeter.
Blaze Angle of Grating: The gratings selected for an excitation or emission monochromator provide optimum throughput at a particular wavelength band, referred to as the blaze angle since this is determined by the angle of grating etching imparted on the grating surface. As such an excitation monochromator with a 350 nm blazed excitation monochromator, and a 400 nm emission monochromator, would be optimal choices to achieve the best water Raman sensitivity when exciting at 350 nm. Since most fluorometers do not allow you to adjust the grating, this variable is not a factor, but for those that do allow you to choose gratings, be sure to choose gratings with the same, or very similar, blaze angle to make a valid comparison.
The experimental conditions for ultrapure water Raman emission scan were as follows.
QuantaMaster QM-8075-11 Spectrofluorometer (75 watt xenon lamp, single excitation and single emission monochromator) with optional cooled PMT housing.
Experimental results are below.
Note that this particular result exceeds the HORIBA minimum water Raman FSD specification for the QM-8075-11 spectrofluorometer when it is fitted with an optional cooled R928 PMT, which is currently specified at > 30,000:1 (FSD Method).
water Raman FSD results
Although care must be taken to ensure that experimental conditions and mathematical formulas are both consistently applied, the water Raman signal to noise ratio is a good determinant of the relative sensitivity of one fluorometer compared to another.
When comparing photon counting spectrofluorometers the FSD (SQRT) Method is preferred.
HORIBA has a decades-long tradition of excellence in fluorescence manufacturing, and we are happy to demonstrate exactly the conditions with which we achieve our industry leading sensitivity specifications.
Do you have any questions or requests? Use this form to contact our specialists.
